 MultiCycle AV Software Features:
-
-
Automatically detects the number of cycling populations
-
-
-
-
-
Exports all results in Excel spread sheet format
-
Exports a high resolution graphic for publications purposes
-
Reads in list mode or histogram data from all commercial flow and image cytometers

One of the earliest applications of flow cytometry was the measurement of DNA content in cells; the first technique available to characterize the non-mitotic phases of the cell cycle. This analysis is based on the ability of certain dyes to stain cellular DNA in a stoichiometric manner(the amount of stain is directly proportional to the amount of DNA within the cell).
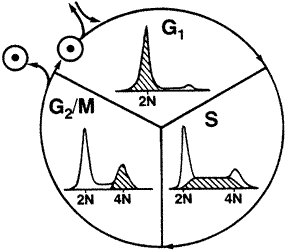
The G1/G0 phase is where cells spend most of their life. All cells of the same species contain the same amount of DNA in the G1/G0 phase. This is called the 2N amount of DNA because there are two copies of each chromosome in the nucleus of the cell. When a cell gets ready to divide, it must first duplicate its DNA so when it divides that each daughter cell has the same amount of DNA as the original cell. This duplication of the DNA is called the S-phase for synthesis of the DNA. Once the cell has finished synthesizing(duplicating) its DNA, it has twice as much as the original cell so contains 4N of DNA. This stage of the cell cycle is called the G2/M. Next the cell goes through mitosis which splits the 4N amount of DNA back into 2N and the cell returns to G1/G0. Keep in mind the cells are not all going through the cell cycle synchronized in one phase of the cell cycle. Some are in G1/G0 while simultaneously some are in S and G2/M. For this reason we get a distribution from the flow cytometer that contains all the phases of the cell cycle. This type of data requires cell cycle analysis software to analyze because of the overlap of the S-phase and the G1 and G2 populations. In addition, if there is debris or the overlap of a second cell cycle (aneuploid) in the DNA sample, a simple analysis with markers on the histogram is highly inconclusive..
DNA content histograms require mathematical analysis in order to extract the underlying G1, S And G2 phase distributions, Methods for this analysis have been developed and refined over the past two decades. The most flexible and accurate method of cell cycle analysis is based upon building a mathematical model of DNA content distribution, and then fitting this model to the data using curve fitting methods. The most well established model, proposed by Dean and Jett in 1974, is based upon the prediction that the cell cycle histogram is a result of the Gaussian broadening of the theoretically perfect distribution. The underlying distribution can be recovered or "de convoluted" by fitting the G1 and G2 Peaks as Gaussian curves and the S phase distribution as a Gaussian-broadened distribution.
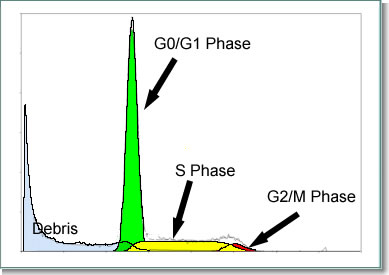
Almost all cell or nuclear suspensions analyzed by DNA content flow cytometry contain some damaged or fragmented nuclei (debris) resulting in events, usually most visible to the left of the diploid G1, which are not fit by the G1, S or G2 compartments. In samples that are derived from fresh tissues or cell suspensions, most of the "debris" is visible close to the origin of the histogram and decreases rapidly farther away. In the best case, the debris signal is an insignificant proportion of the histogram in the region occupied by the cell cycle data. Unfortunately this is often not the case in archived material, stored in paraffin, and accurate debris modeling is critically important in order to subtract the effect of the underlying debris from the cell cycle fitting. Otherwise, the calculated S-phase procentages are artificially high. DNA analysis software that does not incorporate all the features of these models may yield accurate results in the ideal scenarios, but will often return incorrect results in even mildly complex situations. Worse, it is difficult to simply look at these results and appreciate that they are invalid.
MultiCycle AV software was developed 20 years ago to address these complicated problems. It has evolved into a Windows product which can easily analyze the most complicated DNA histogram and seamlessly export the data in a graphic or database format. Here is how a typical analysis with MultiCycle AV is performed:
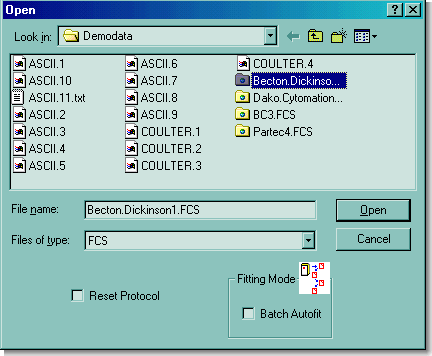
Start the program and select a data file previously acquired on the flow cytometer. (MultiCycle AV does have a feature to "watch" a directory on the computer and automatically perform an analysis when a new file is added by the data acquisition software of the flow cytometer.) MultiCycle AV will read histogram or list mode files in FCS format from all commercial flow cytometers.
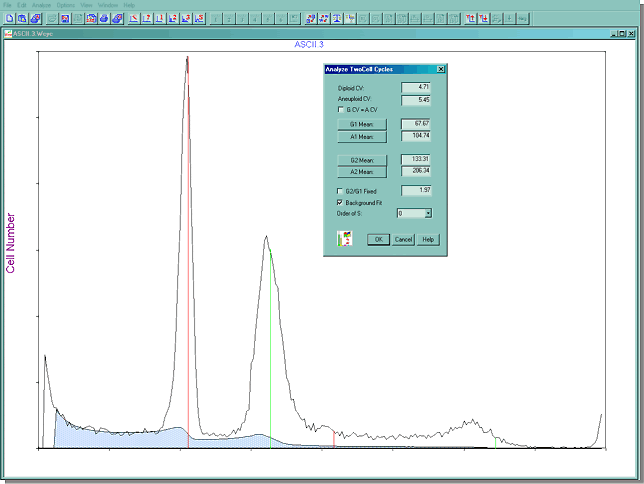
Once the file is read in, MultiCycle AV quickly calculates what portion of the histogram is debris and how many cell cycle are in the data.The debris that will be subtracted from the final result is the shaded blue portion below. This histogram contains two cell cycles, a diploid and aneuploid cycle. An aneuploid cycle is a population of cells in the DNA histogram with an abnormal amount of DNA
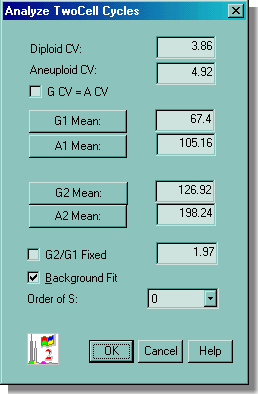
Of course, if the operator of the software doesn't agree with the way that MultiCycle AV has automatically modeled the data, any of the cell cycle analysis parameters can be changed by clicking on the appropriate box. Here is a picture of the Analyze Two Cell Cycle menu showing the various parameters that can be easily changed by clicking on them.
If the operator is satisfied with the "initial fit" of the data, then the OK button is clicked and MultiCycle AV applies its sophisticated mathematical modeling algorithms to the data deconvoluting it in seconds.
The final results are shown below. All the statistics of the individual compartments of the two cell cycles are listed on the right hand side of the screen. The G1 peak closest to the origin is normally called the diploid peak. If a second cell cycle is detected to the right of the diploid peak, it is called an aneuploid cycle.
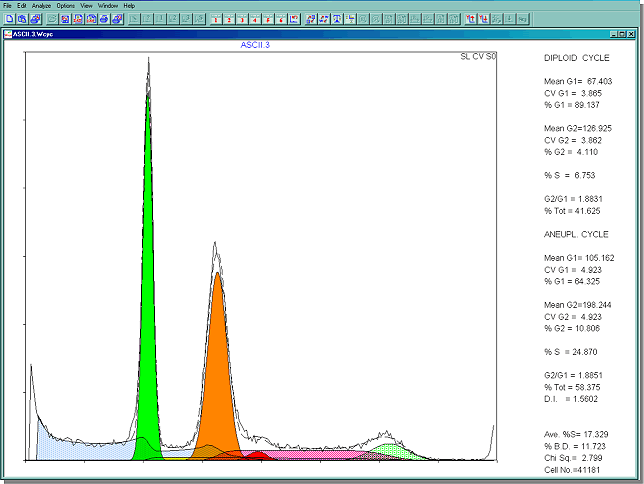
Often the results from the cell cycle analysis may appear confusting and hard to interpretat the results, don't despair. The MultiCycle AV software can help to interpret the results. By clicking a button on the menu of the MultiCycle AV software; the software will evaluate the goodness & reliability of the mathematical fit of the data. It performs this operation by automatically making 6 different changes to the mathematical model and then refitting the data each time it changes something. The idea behind this is if the mathematical model is changed a little bit and then the model reports back results that are not too different then the original ones, the model is doing a good job of fitting the data and so the results must be reliable. If the results come back all screwy after subtle changes to the model, then the mathematical model is having a hard time fitting the data and the results are unreliable and unbelievable. If this is the case, the MultiCycle AV software reports the results as illustrated below.
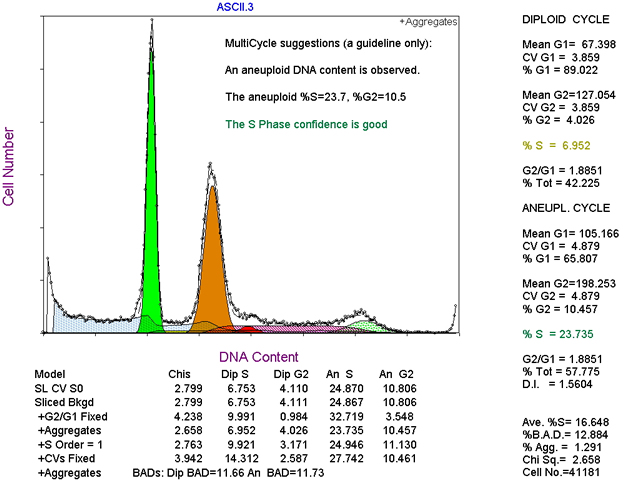
MultiCycle AV thinks the S phase confidence of the aneuploid population (purple shading) is good. It also reports that the S-phase of the diploid population is questionable because the number %S = 6.952 is in yellow print as opposed to the S phase of the aneuploid population that is in green.
It is imperative to remember that cell cycle analysis software is only a tool. The final decision of whether the results are believable is up to the operator of the software. The classic rule of flow cytometry data analysis applies-"Garbage in=Garbage out". DNA histograms with hugh amounts of debris overlaying the cell cycle data or wide CV's are not interpretable no matter how good the software.

Crucial Factors in DNA Cell Cycle Analysis:
-
SAMPLE PREPARATION-Garbage in- Garbage out Least amount of debris in the sample. Best possible staining of DNA=Low CV's
-
SUB G1 APOPTOTIC PEAKS if you are looking for a peak below the G1 peak as an indication of apoptosis, fine hopefully you will have a well defined peak so the cell cycle software will be able to fit it.. If instead you have a shoulder on the left side of the G1 peak, don't expect the cell cycle software to be able to fit it and give a reliable answer..
-
CORRECT CELL CONCENTRATION-Between 1 and 10 million cells per ml. Too many cells and they may not all stain completely
-
STAINING SOLUTION-correctly formulated so there is enough dye for all cells in the sample
-
PROPERLY ALIGNED FLOW CYTOMETER-If beads give you lousy CV's how can you expect your DNA histogram to look good?
-
COLLECTING ALL THE DATA-A list mode file will do you no good if the gain on the flow cytometer was too high and you cut off the G2 peak of a tetraploid population.
![]() MultiCycle AV Software Features:
MultiCycle AV Software Features:


